Linux Live Forensics (Part 2): Investigating Running Processes
- DFIRHive

- Oct 14, 2025
- 3 min read

In Part 1, we built the system profile — understanding the host’s OS, kernel, hardware, users, and storage layout.
Now we’ll look at what’s actually running right now — the processes, services, and commands executing in real time. This step is critical because it shows us what the system is doing at this exact moment, which often exposes the footprint.
Investigating Running Processes – Looking Inside the System
Identify suspicious or hidden activity in real time
Why this matters?
Every action on a Linux machine — from launching a script to opening a network connection — creates a process. By reviewing process data, we can identify unusual executions, privilege escalations, or persistence mechanisms hiding in memory.
a. Listing All Running Processes
Command:
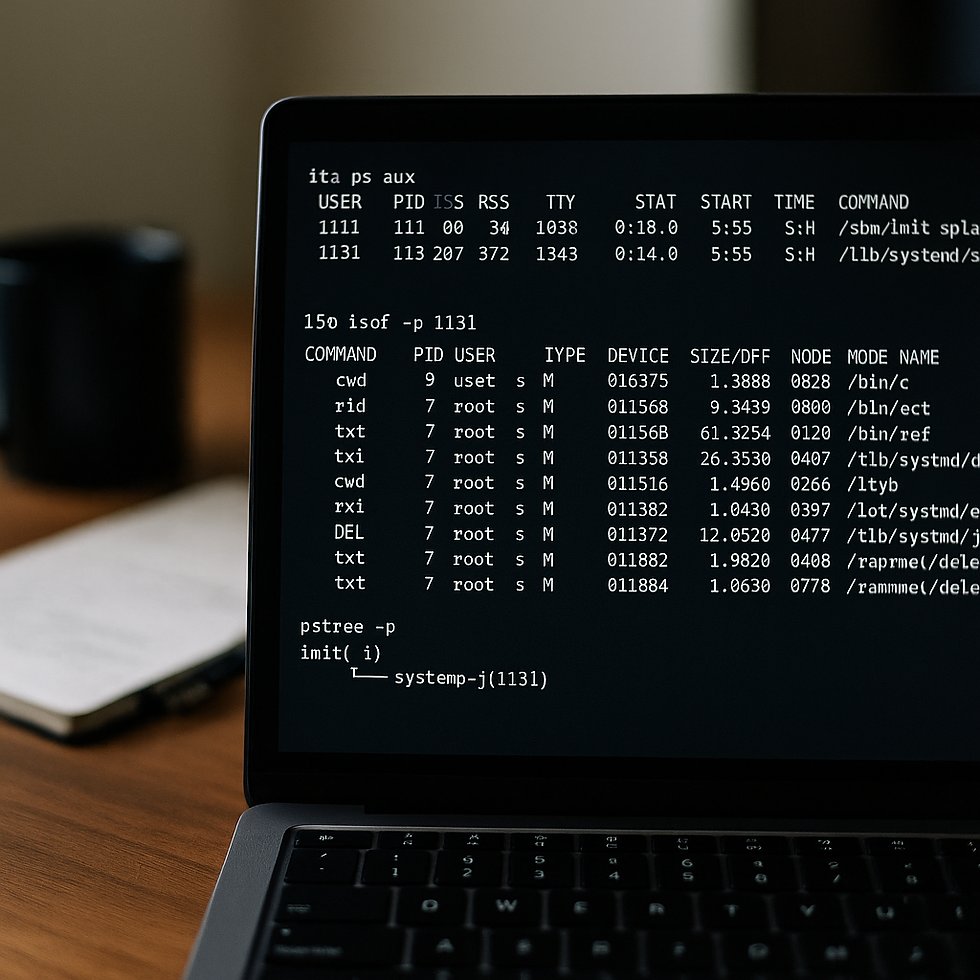
ps aux

This command gives a complete list of active processes, their owners, CPU and memory usage, and the commands used to start them.
We should look for:
Processes owned by unexpected users
Commands executed from /tmp, /var/tmp, or /dev/shm
Random or obfuscated names
Processes consuming unusual resources
b. Monitoring Processes in Real Time
Command:
top
OR,
htop


top offers a dynamic, real-time view of running processes. we can check system performance and resource usage, showing which processes consume the most CPU and memory. and htop command is similar to top but with an improved interface and additional features. It allows for easier process management and includes color coding for better readability.
c. Visualizing Process Hierarchies
Command:
pstree -p

Command | Output |
pstree | Process hierarchy (names only) |
pstree -p | Hierarchy with PIDs |
It displays processes in a tree format, showing the parent-child relationships between processes. Seeing a strange child process under sshd, apache2, or bash can indicate post-exploitation activity.
d. Searching for Specific Processes
Command:
pgrep <name>
This will search for processes based on name and other attributes. It is useful for filtering and finding specific processes.
OR,
pidof <service>It is used to find a running program's process ID (PID) by name. This is useful when you know the process's name and need its PID for further investigation or action.
e. Inspecting Open Files and Connections
Command:
lsof -i
OR,
lsof -p <PID>
Command | Focus |
lsof | Lists all open files |
lsof -i | Lists only network connections |
lsof -p <pid> | Files linked to one process |
This will lists open files and the processes that opened them. This can help identify which processes use specific files, sockets, or network connections.
f. Investigating a Suspicious Process — Command Breakdown
Let’s assume, we have found a strange process with PID 2734 using ps aux or top command
For example,
ubuntu 2084 0.5 0.3 42000 8120 ? S 10:22 0:00 /tmp/.update
Now we want to learn everything about what this process is and where it came from.
Find the Executable Path
Command:
ls -l /proc/<PID>/exe
Example:
ls -l /proc/2084/exe

What it does: Every running process in Linux has a directory under /proc/ that matches its PID (e.g., /proc/2084).Inside that directory, the file exe is a symbolic link pointing to the actual binary file that’s being executed.
So this command shows where the executable lives on disk.
2. View Command-Line Arguments
Command:
cat /proc/<PID>/cmdline
Example:
cat /proc/2084/cmdline
What it does: This shows the exact command line used to start that process — including parameters, scripts, or hidden flags.
3. Check the Parent Process
Command:
cat /proc/<PID>/status | grep PPid
Example:
cat /proc/2084/status | grep PPid
What it does: This pulls the Parent Process ID (PPid) — the process that started this one.
4. Check Environment Variables
Command:
cat /proc/<PID>/environ
Example:
cat /proc/2084/environ
What it does: Shows the environment variables the process is using — things like PATH, USER, HOME, or custom variables.
g. Reviewing User Activity and Sessions
In Part 1, we checked user logins to establish a baseline.
Now we’ll connect that data to the processes we see in memory.
Commands:
who
w
last
cat ~/.bash_history
Explanation:
who and w show which users are currently logged in and what commands or terminals they’re using.
last lists historical login sessions — helpful for spotting unexpected remote logins or logins at unusual hours.
.bash_history reveals what each user has recently executed in their shell.
Recording the Findings
It is important to preserve the outputs for correlation and reporting.
Commands:
mkdir process_logs
ps aux > process_logs/ps.txt
pstree -p > process_logs/pstree.txt
lsof -i > process_logs/network.txt
Thanks for reading!
In Part 3, we’ll move into network forensics — exploring live connections, routes and Persistence.


Comments