Volatility: A Beginner’s Guide to Memory Analysis
- DFIRHive

- Sep 30, 2025
- 6 min read
Updated: Oct 1, 2025

"A memory dump holds more secrets than most hard drives—if you know how to read it."
When investigating malware or insider threats, memory often tells the real story. Unlike disk artifacts, RAM reveals what was running, what was injected, and even what credentials were stored in memory at the time. That’s why memory acquisition is only the first step. The real challenge begins once you have the dump — making sense of it
That’s where Volatility comes in.
Volatility is the go-to memory forensics framework—Python-based, open-source, and trusted by DFIR teams worldwide. It’s modular, cross-platform, and completely open-source, making it a must-have in every investigator’s toolkit.
What Makes Volatility Special?
Volatility allows us to extract digital artifacts directly from RAM without touching the live machine. Think of RAM as a crime scene frozen in time — and Volatility lets us examine it without disturbing the evidence.
This is powerful during investigations because it means:
Investigate without altering the suspect system
Gain full visibility into the system’s runtime state
Uncover processes, drivers, DLLs, network activity, and injected code
Volatility Versions: 2 vs 3
Feature | Volatility2 (Legacy) | Volatility3 (Modern) |
Language | Python 2 | Python 3 |
Maintenance | Deprecated | Actively maintained |
Ease of Use | Older, less intuitive | Streamlined, modern syntax |
Use Case | Legacy images only | All modern investigations |
Recommendation: Always use Volatility3 for new investigations. It’s actively maintained, supports modern systems, and has updated syntax.
Preparing Memory Dumps
Volatility only analyzes existing memory dumps. The first step is to obtain a memory image using the right tool for your environment:
On Windows → Tools like FTK Imager, DumpIt, or WinPmem
On Linux → Tools like LiME and AVML are widely used
On Virtual Machines → Use hypervisor snapshots:
.vmem (VMware)
.bin (Hyper-V)
.sav (VirtualBox partial dumps)
Note: Always generate a hash (preferably SHA256) both before and after analysis. This ensures the dump’s integrity and preserves the chain of custody.
Read Blog here: Capturing-volatile-memory-on-windows
Read Blog here: Capturing-volatile-memory-on-linux
Setting Up Volatility
To start working with Volatility, we’ll need to set it up properly. Installation is straightforward, but the method we choose depends on our environment:
Cloning the GitHub repository (best for Linux, macOS, and WSL users).
Downloading the pre-packaged release (simpler for Windows users).
Requirements
→ Volatility 3 is built for Python 3 (the old Volatility 2 used Python 2). Running Python 3 ensures that we can use the latest plugins and updates.
→ This is critical for parsing Windows executables and DLLs — a must if your target is a Windows dump
Optional (but recommended): yara-python and capstone for advanced detection
→ yara-python/capstone → These are optional but highly valuable while hunting advanced malware like fileless threats or injected code.
If you’re working with Linux or macOS dumps, remember also to download symbol tables
→ Think of symbol tables as a “map” of the kernel’s memory layout. Without them, Volatility won’t know how to interpret certain parts of the dump.
Option 1: Installing Volatility in WSL (Windows Subsystem for Linux)
"Since I’m running Volatility on a Windows system, I chose to set it up inside WSL. This allows me to use Linux commands without spinning up a full virtual machine."
Clone the repository:
git clone https://github.com/volatilityfoundation/volatility3.git 
Test your installation:
python3 vol.py -h
(Optional) Install extras
pip3 install <yara> <capstone>
(YARA = detect malware patterns, Capstone = disassembler)
Option 2: Running from ZIP on Windows
Download the latest ZIP from Volatility3 GitHub Releases. Extract it to a location of your choice (e.g., D:\volatility3).
Navigate to the extracted folder in CMD:
cd D:\volatility3Run Volatility with Python:
python vol.py -hIf you installed Python correctly, this will bring up the help menu.
This method is simpler if you don’t want to use WSL or Git. Perfect for quick testing on a Windows box.
Note: Add Python and Volatility’s folder to your PATH so you can run it from anywhere.
Getting Started with Analysis:
If you don’t already have a dump from an investigation, don’t worry — there are free, public images you can use for practice:
These dumps are safe to use and perfect for learning.
Identify the Memory Image (OS, Build, and Architecture).
The first thing we do in any memory analysis is extract basic system information. This tells us what operating system and build the dump belongs to, which helps guide the rest of the investigation.
Command:
python3 vol.py -f memory.raw windows.info

This output reveals key details:
OS version and build → Confirms if it’s Windows 10, 11, etc.
System architecture (32/64-bit) → Important when choosing tools or payloads.
System time → When the memory was captured, helping establish the timeline of the incident.
For example, in my case:
NtMajorVersion: 10, Build: 22621 → Windows 11 (22H2).
Is64Bit: True → Confirms 64-bit architecture.
Analyst Tip: Cross-check build numbers with official Microsoft release lists. Build 19045 = Windows 10 22H2, Build 22621 = Windows 11 22H2.
Investigating Processes (Finding Active, Hidden, and Suspicious Tasks)
Attackers can’t do much without running processes. Volatility gives us multiple plugins to analyze them
a. List active processes (pslist)
python3 vol.py -f memory.raw windows.pslist

Shows all processes in the active process list, including those recently exited. Great for spotting what was running at capture time.
b. Find hidden or unlinked processes (psscan)
python3 vol.py -f memory.raw windows.psscan

Suspicious Process Found: @WanaDecryptor@, taskdl.exe, taskse.exe
Ransomware GUI for WannaCry.
Confirmed malicious.
Unlike pslist, psscan digs through memory structures, so even if malware tries to unlink itself, one can still find it.
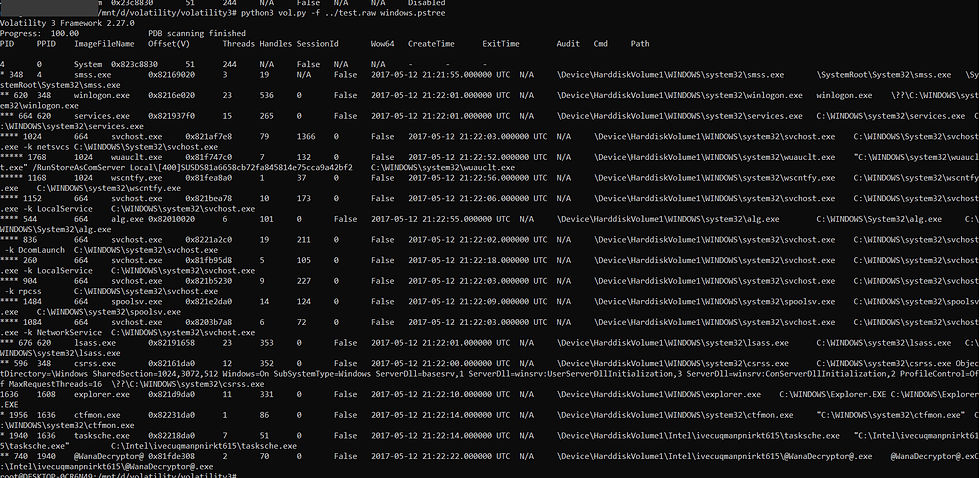
c. Review process hierarchy (pstree)
python3 vol.py -f memory.raw windows.pstree

Displays how processes are related. This makes it easy to spot suspicious chains (e.g., explorer.exe was abused to launch ransomware components).
Cross-checking results: By comparing pslist with psscan, we can catch hidden malware. For example:
If a process appears in psscan but not in pslist, it’s likely trying to hide.
Using pstree, we can verify if that process has a suspicious parent (like Explorer spawning a ransomware binary).
Checking Network Activity (Spotting C2 & Suspicious Connections)
To see what connections were live when the dump was captured:
python3 vol.py -f memory.raw windows.netstat
This isn’t always stable on older Windows builds, but when it works, it’s a goldmine for spotting C2 traffic or unusual outbound connections. If Volatility fails, I sometimes fall back to extracting a PCAP from memory using tools like bulk_extractor and analysing it within Wireshark.
Digging into DLLs (Uncovering Malicious Code Libraries)
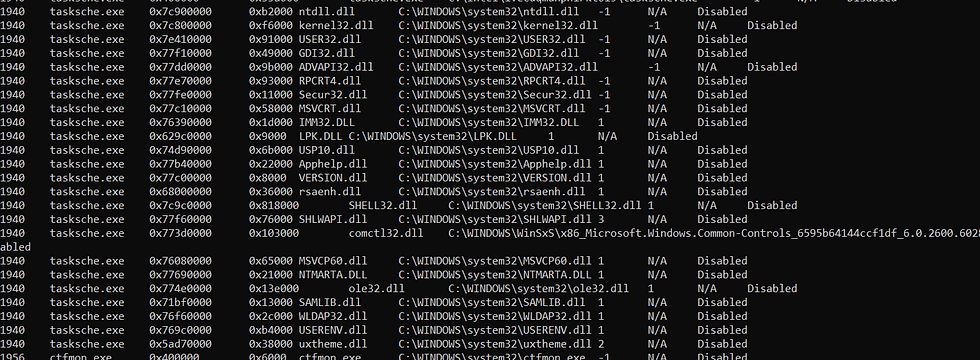
Another area to always check is DLLs loaded into processes:
python3 vol.py -f memory.raw windows.dlllist

This can highlight suspicious libraries, especially if a process is pulling in modules or custom DLLs it normally wouldn’t touch. In this case, tasksche.exe (a WannaCry ransomware process) loads: Core Windows DLLs (for normal API calls) and Cryptography DLLs (rsaenh.dll, advapi32.dll) → consistent with ransomware encryption → strong evidence of malicious behavior.
Hunting for Malware (Injected Code, YARA Hits, and Rootkits)
Volatility isn’t just for listing processes—it can also catch injected code and memory-resident malware.
windows.malfind → Scans for injected code regions
windows.yarascan → Runs YARA rules directly against memory
Example:
python3 vol.py -f memory.raw windows.malfind
python3 vol.py -f memory.raw windows.yarascan

The malfind plugin flagged several suspicious memory regions inside processes like explorer.exe and csrss.exe.
Notice the PAGE_EXECUTE_READWRITE permission — this is a flag because normal memory regions shouldn’t be writable and executable at the same time
Advanced Hunting:
For more evasive malware—like rootkits—Volatility offers deeper plugins:
windows.ssdt → Detects SSDT hooks
windows.modules → Lists kernel modules
windows.driverscan → Scans memory for hidden or malicious drivers
Checklist:
Start broad, then narrow → Begin with windows.info, then processes.
Preserve evidence → Always hash and log commands.
Correlate findings → Don’t trust a single plugin.
Timeline analysis → Use timestamps to rebuild events.
Document everything → Investigations must stand up in court.
Wrapping Up:
Volatility acts as the bridge between raw memory and actionable forensic evidence. With the right plugins, it helps investigators uncover hidden processes, code injections, persistence tricks, and even kernel-level tampering — all without touching the live system.
In this blog, we walked through installation, setup, and some of the most important plugins you’ll use when starting with memory forensics. Each step was explained with practical examples and screenshots, so you can replicate the workflow on your own.
In upcoming blogs, we’ll dive deeper into advanced Volatility plugins and explore real-world scenarios — from detecting stealthy malware to analyzing rootkits and persistence mechanisms.
Until then — Happy Learning!


Comments