
Windows Memory & Network Analysis: Volatility3 Walkthrough
- DFIRHive

- Oct 11, 2025
- 7 min read
In the previous post, we explored user and process activity from a Windows memory dump using Volatility3.
This time, we’ll take the next step — investigating network activity captured in RAM.
While often overlooked, network artifacts in memory are incredibly valuable for reconstructing attacker behavior. Memory forensics enables analysts to:
Recover both active and terminated network connections.
Identify hidden or short-lived sockets invisible to tools like netstat.
Link network endpoints directly to specific processes.
Correlate malicious binaries with their command-and-control (C2) traffic.
These insights help bridge the gap between what was running and how it communicated — a critical piece in any intrusion investigation.
Lab Context
For this analysis, I used the memory dump from the freely available DumpMe challenge on CyberDefenders.org. The scenario simulates a targeted intrusion involving Meterpreter payloads, script-based execution, and outbound C2 activity.
Our objectives in this walkthrough are to detect:
Active and historical network connections
Suspicious ports or endpoints linked to malicious processes
Process-to-connection relationships within memory
Indicators of command-and-control or data exfiltration
All analysis was conducted using Volatility 3, focusing exclusively on memory-resident network artifacts.
Step 1: Scanning Memory for Network Evidence
To begin, we used the windows.netscan plugin — one of the most powerful and reliable ways to enumerate TCP/UDP socket objects from within a Windows memory image.
Unlike netstat, which depends on live system data, Volatility’s netscan plugin parses kernel memory pools directly, uncovering both active and recently closed connections that may otherwise go unnoticed on a running system.
Command:
python3 vol.py -f Triage-Memory.mem windows.netscan > netscan.txtOnce complete, we can display or filter the results:
cat netscan.txt

How It Works:
The plugin identifies EPROCESS structures (representing process IDs) and maps them to TCP and UDP socket objects.This correlation allows analysts to pinpoint which process was responsible for each network connection, even if the process has since terminated.
Indicators to Watch For:
While reviewing netscan results, focus on patterns that often indicate malicious or post-exploitation behavior:
Outbound connections to unfamiliar IPs or external networks
Services listening on non-standard ports
Local processes maintaining multiple simultaneous sockets
PIDs already flagged as suspicious during prior process analysis
Tip: Look for LISTENING ports that don’t match standard Windows services (like 4444, 8080, or random high ports).Attackers often configure their payloads to listen on these as hidden reverse shell endpoints or C2 listeners.
Step 2: Reviewing the Network Scan Results
From the previously generated netscan.txt output, several connections stood out immediately:
PID | Process | Local Address | Foreign Address | Port / State | Interpretation |
3496 | UWkpjFjDzM.exe | 10.0.0.101:49217 | 10.0.0.106:4444 | ESTABLISHED | Highly suspicious — maintains a reverse connection to port 4444, commonly used by C2 payloads. |
3952 | hfs.exe | 0.0.0.0:80 | * | LISTENING | Unauthorized HTTP service, possibly used to host or exfiltrate files. |
1476 | FileZilla Server.exe | 0.0.0.0:21 | * | LISTENING | FTP service not native to Windows — likely attacker-deployed for data transfer. |
5116 | wscript.exe | 127.0.0.1:55560 | * | UDP | Suggests active script-based execution, potentially handling local communication. |
Quick Commands:
strings netscan.txt | grep -i Established
strings netscan.txt | grep -i listening
Normal system processes such as svchost.exe and lsass.exe were bound to standard service ports (139, 445, 3389), but the entries above stood out as potential signs of post-compromise activity.

Observations:
Outbound C2 Activity: UWkpjFjDzM.exe (PID 3496) establishes an active reverse connection to 10.0.0.106:4444, consistent with command-and-control frameworks such as Meterpreter.
Local Staging / Exfiltration Setup: hfs.exe and FileZilla Server.exe appear to act as local servers, suggesting the compromised host was repurposed to store or transfer attacker-controlled data.
Script Interaction: wscript.exe maintains a UDP connection on localhost, reinforcing its role in automated or persistent malicious execution — likely the delivery stage before payload activation.
Step 3: Linking Connections to Process Behavior
The network scan revealed a randomized payload UWkpjFjDzM.exe (PID 3496) maintaining an ESTABLISHED connection to 10.0.0.106:4444. To determine whether that process provided remote access (Meterpreter/C2) and what the attacker did post-access, we correlated process listings, trees and command lines.
Objective:
Determine whether UWkpjFjDzM.exe provided remote access (Meterpreter/C2) and whether any post-exploitation activity is evident in memory.
Commands used:
python3 vol.py -f Triage-Memory.mem windows.pslist  > pslist.txt
python3 vol.py -f Triage-Memory.mem windows.pstree  > pstree.txt
python3 vol.py -f Triage-Memory.mem windows.cmdline > cmdline.txt

grep -E '3496|3952|5116|4660|1476' pslist.txt pstree.txt cmdline.txt

Process Relationship Chain:
Parent (Name) | Parent PID | Child (Name) | Child PID | Notes / Interpretation |
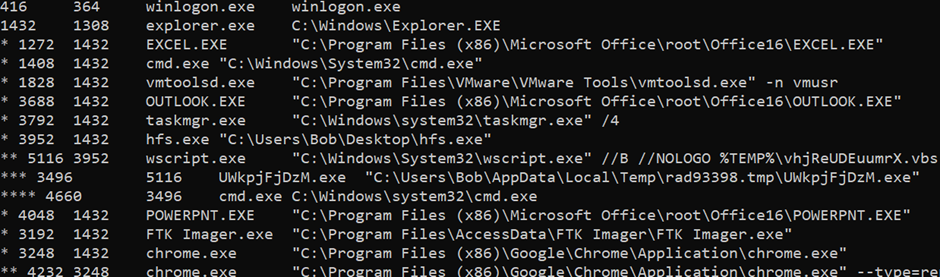
explorer.exe | 1432 | hfs.exe | 3952 | hfs.exe launched under user explorer (interactive) — abnormal for a workstation. |
hfs.exe | 3952 | wscript.exe | 5116 | wscript was started by HFS and runs a temp VBS (%TEMP%\vhjReUDEuumrX.vbs). |
wscript.exe | 5116 | UWkpjFjDzM.exe | 3496 | Dropped/random-named EXE executed from Temp. |
UWkpjFjDzM.exe | 3496 | cmd.exe | 4660 | Payload spawned an interactive shell (cmd). Strong indicator of post-exploitation control. |
explorer.exe | 1432 | EXCEL.EXE | 1272 | Legitimate Office process under the same interactive session (context). |
explorer.exe | 1432 | POWERPNT.EXE | 4048 | Office app present in same session. |
explorer.exe | 1432 | notepad.exe | 3032 | Normal user app but multiple editors were observed in the session. |
services.exe | 476 | FileZilla Serv | 1476 | FileZilla installed as a service — unusual on a user endpoint; correlates with netscan showing FTP listening. |
some parent (PID 1860) | 1860 | FileZilla Serv (Interface) | 1996 | GUI/Interface for FileZilla — appears with PID 1996 and PPID 1860 in the output. (Parent 1860 is present in the tree; treat as service-management parent.) |
Confirmed sequence:
explorer.exe → hfs.exe → wscript.exe → UWkpjFjDzM.exe → cmd.exe
No arguments were passed to the payload, which is typical for droppers or loaders that perform in-memory injection — a technique frequently used by Meterpreter.
Observations:
explorer.exe → hfs.exe (PID 3952) — interactive user launched HFS.
hfs.exe → wscript.exe (PID 5116) — VBS executed from %TEMP%.
wscript.exe → UWkpjFjDzM.exe (PID 3496) — randomized EXE dropped/started from Temp.
UWkpjFjDzM.exe → cmd.exe (PID 4660) — payload spawned an interactive shell.
Step 4: Scanning for Code Injection: Detecting Meterpreter
After establishing that UWkpjFjDzM.exe (PID 3496) spawned cmd.exe (PID 4660), the next step was to verify whether the payload contained injected or reflectively loaded code
Volatility’s windows.malfind plugin detects suspicious Virtual Address Descriptors (VADs), such as mapped regions with PAGE_EXECUTE_READWRITE, which often indicate shellcode or in-memory modules loaded at runtime.
Command:
python3 vol.py -f Triage-Memory.mem windows.malfind --pid 3496 
Findings:
malfind identified multiple RWX VADs in UWkpjFjDzM.exe (PID 3496).
Each memory region began with an MZ header (4D 5A) but had no on-disk backing file, confirming that the executable code resided entirely in memory.
The discovery of multiple PE headers in RWX space is a strong indicator of in-memory code injection or reflective DLL loading — both techniques commonly used by Meterpreter and other fileless post-exploitation frameworks.
Step 5: Confirming Meterpreter with YARA
After identifying potential code injection in the previous step, the next goal was to confirm whether the injected payload corresponds to a known post-exploitation framework — such as Meterpreter.
Why Use YARA for Memory Analysis:
YARA helps identify known malware families or payloads by scanning for unique string or byte patterns within memory or binary files. Here, we used a custom rule to look for Meterpreter reverse_tcp shellcode signatures directly inside the process memory of UWkpjFjDzM.exe (PID 3496).
YARA Rule Definition:
rule meterpreter_reverse_tcp_shellcode {
    meta:
        description = "Metasploit reverse_tcp shellcode"
    strings:
        $s1 = { fce8 8?00 0000 60 }
        $s2 = { 648b ??30 }
        $s3 = { 4c77 2607 }
        $s4 = "ws2_"
        $s5 = { 2980 6b00 }
        $s6 = { ea0f dfe0 }
        $s7 = { 99a5 7461 }
    condition:
        5 of them
}
This rule searches for seven distinct byte sequences commonly embedded in Metasploit’s reverse_tcp shellcode.
If at least five of these patterns are detected, the rule triggers — signaling a strong match for Meterpreter activity.
Executing the Scan:
We applied the rule to UWkpjFjDzM.exe (PID 3496) using Volatility’s windows.vadyarascan plugin, which scans each virtual address descriptor (VAD) region allocated to the target process. This method minimizes false positives by focusing only on active process memory.
python3 vol.py -f Triage-Memory.mem windows.vadyarascan --pid 3496 --yara-file meterpreter.yar
Command:
python3 vol.py -f THM-WIN-001_071528_07052025.mem windows.vadyarascan --pid 10032 --yara-file meterpreter.yar
Results:
The scan returned multiple matches across the process memory.All seven YARA patterns were detected — confirming the presence of Meterpreter reverse_tcp shellcode inside the memory of UWkpjFjDzM.exe.
When correlated with the findings from malfind (RWX + MZ headers) and netscan (C2 connection to 10.0.0.106:4444), this solidifies the conclusion that the process was acting as a live Meterpreter reverse shell, loaded reflectively and operating fully in memory.
Tip: You can extend this method to detect other frameworks — like Cobalt Strike or Empire — by adding their respective shellcode patterns to your YARA library
Step 6 : Post-Exploitation Communication
Once a reverse shell is active, it’s common for the attacker to open secondary channels for lateral movement, staging, or command retrieval.
From the network and memory artifacts, two processes stood out:
UWkpjFjDzM.exe (PID 3496) — ESTABLISHED to 10.0.0.106:4444 (remote C2/reverse shell).
hfs.exe (PID 3952) — LISTENING on 0.0.0.0:80 (local HTTP service; likely used for staging or file hosting).
Why wscript.exe and cmd.exe matter:
wscript.exe is often the delivery/orchestration stage (VBS): it may contain inline script code, download URLs, or ADODB/Stream calls used to persist or drop binaries. Recovering wscript memory can reveal the exact delivery steps.
cmd.exe is the on-host command interface. Although it may not hold the network socket (the payload often keeps that), cmd typically contains the attacker’s executed commands, file paths, internal targets, and staging/exfiltration activity.
Quick forensic triage (commands & items to extract)
1) Dump process memory
python3 vol.py -f Triage-Memory.mem windows.memmap --pid 4660 --dump
python3 vol.py -f Triage-Memory.mem windows.memmap --pid 5116 --dump
python3 vol.py -f Triage-Memory.mem windows.memmap --pid 3952 --dump 
2) Extract readable strings (fast triage)
strings -n 8 pid.4660.dmp     > 4660.strings.txt
strings -n 8 pid.5116.dmp     > 5116.strings.txt
strings -n 8 pid.3952.dmp     > 3952.strings.txt
3) Pull network IOCs and staging indicators
# URLs
grep -Eo 'https?://[A-Za-z0-9./?=_:-]+' 4660.strings.txt > pid.4660.urls.txt

# IPv4 addresses
strings pid.4660.dmp | grep -Eo '\b([0-9]{1,3}\.){3}[0-9]{1,3}\b'  > 4660.ips.txt

# Execution/staging keywords
egrep -i 'wget|curl|bitsadmin|Invoke-WebRequest|certutil|ADODB.Stream|SaveToFile|Shell|WScript\.Shell' 5116.strings.txt > 5116_hits.txt

# HTTP artifacts from HFS memory
strings -n 8 pid.3952.dmp  | egrep -i 'GET|POST|Content-Type|/uploads/|/downloads/|/files/' > 3952_http_hits.txt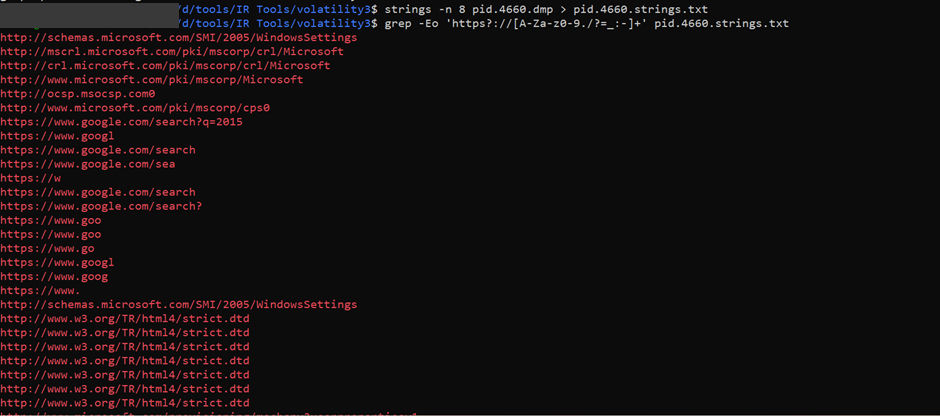
What to look for (priority evidence)
Direct C2 URLs or IPs that match netscan entries.
Download links / file-hosting URLs
Command keywords such as wget, curl, ftp, psexec, net use that reveal staging or lateral activity.
HTTP POST bodies or Content-Type lines in HFS dumps → possible POST-based exfiltration.
Any internal IPs or usernames that point toward lateral targets.
Interpretations:
From the memory dump analysis, no clear evidence of active exfiltration (such as successful HTTP POST requests) was found.However, traces within the cmd and wscript dumps revealed several Google Drive and Pastebin URLs along with Exploit-DB references, suggesting the system was used for tool staging or payload retrieval rather than passive browsing.
Additionally, the HFS (HTTP) and FileZilla (FTP) listeners observed in netscan — combined with these download traces — indicate the host may have been temporarily configured as a local file-hosting / staging node for the attacker.
"While this lab environment is simulated, the pattern aligns with a post-exploitation phase where wscript.exe automated payload delivery and cmd.exe handled network interaction or data movement."
Short recommendations:
Preserve and hash all extracted memory dumps and file objects.
Correlate each suspicious URL/IP with netscan and process timestamps to build a definitive timeline.
Sandbox any recovered payloads and scan them with YARA/AV + static analysis tools.


Comments